Through astrophotography, I explore the universe by capturing light. In my sonification workshops, I invite learners to explore astronomical observations through another sense: hearing.
Sonification translates data into sound. Features such as brightness, color, and position can be represented by pitch, volume, or different instruments. NASA’s
Hearing Hubble and the Chandra X-ray Observatory’s A Universe of Sound demonstrate how telescope observations can become listening experiences. These examples are translations of data, rather than microphone recordings from space.
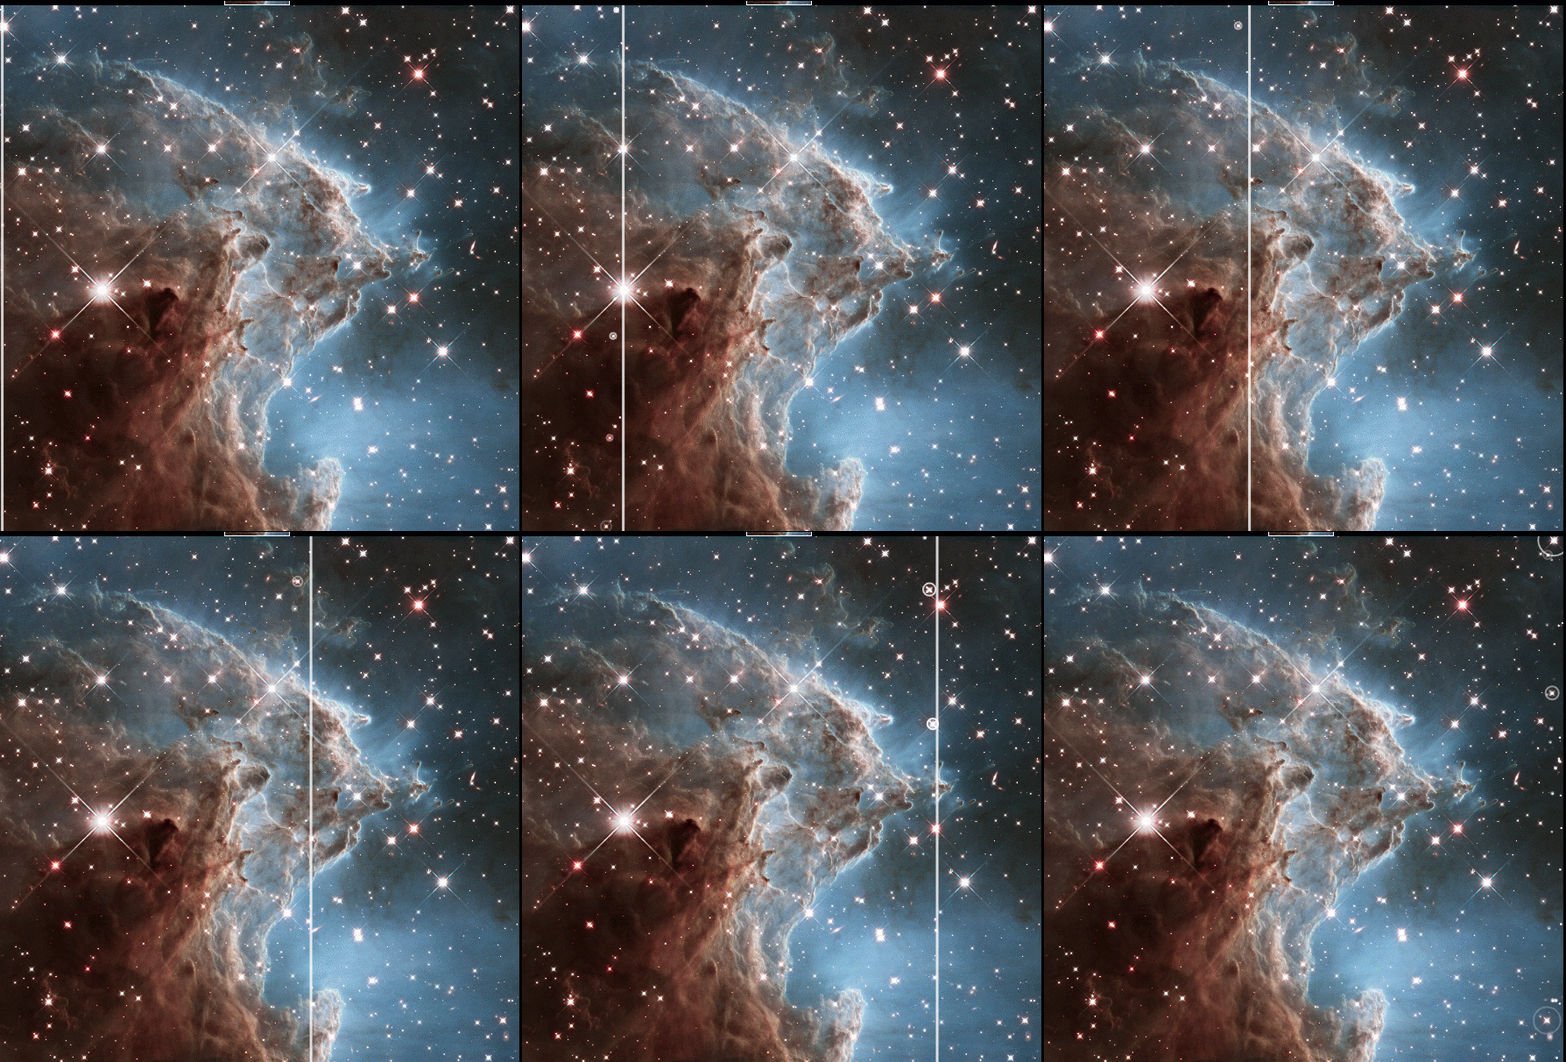
The example I’m sharing here features the Monkey’s Head Nebula in Hearing Hubble.
Also known as NGC 2174, this stellar nursery lies approximately 6,400 light-years away. Hubble captured this infrared view for its 24th anniversary in 2014. Ultraviolet radiation from newly formed stars sculpts the surrounding clouds into pillars.
As the scanning line moves across the image, the app translates features into sound. With brightness mapped to pitch, brighter regions produce higher notes. With color mapped to pitch, redder image regions produce lower notes and bluer regions produce higher ones. Listeners can also change the scan direction, speed, instruments, and musical scale. Explore Hearing Hubble.
Chandra: Listening across different kinds of light
Chandra X-ray Observatory’s A Universe of Sound offers another perspective by combining X-ray observations with data from other telescopes. Different sounds can distinguish structures revealed by different wavelengths.
In its sonification of the region around Sagittarius A*, our galaxy’s central supermassive black hole, a scan moves from left to right. Brightness controls volume, while vertical position determines pitch. Soft synthesizer tones represent X-rays; bass notes and plucked sounds represent infrared observations. Listen to Chandra’s Sagittarius A* example.
The Vela Pulsar provides a striking connection between sound and physical behavior. Its sonification includes a synthesizer pulse repeating 11 times per second, matching the pulsar’s rotation rate. A clockwise scan maps brightness to volume and distance from the image’s center to pitch. Listen to the Vela Pulsar.
Listening with a scientific question
In my workshops, I invite learners to connect changes in sound with the features being scanned. What happens at a bright star? How does a darker cloud affect the notes? What changes when we choose a different mapping?
These questions help us interpret sonification carefully. A higher note has meaning only in relation to the chosen mapping. It might represent brightness, image color, or position—not necessarily a hotter star. Similarly, scanning across an image creates a sequence in sound; it does not necessarily represent an object changing over time.
Sonification also offers another route into astronomy for blind and low-vision learners. Clear descriptions and explanations of the mappings help connect the audio with the science.
For me, this is where curiosity and creativity meet. Looking and listening offer different ways to explore the same observations—and new reasons to ask questions.
Explore NASA’s Hearing Hubble and Chandra’s A Universe of Sound, and find more examples at my non-profit Voices of the Universe.


Leave a Reply